By James Owen
Editor’s note: This is the second blog in a series aimed at understanding the what, where, why, and how of unbanked and underbanked households.
If you love maps, this is the blog post for you. And if you like numbers, here are two important ones: seven and 20.
In last month’s feature on the unbanked and underbanked, we defined what the terms mean: unbanked and underbanked households live outside of the financial mainstream, relying on varying degrees of costly alternative financial services like payday loans or check cashers.
But where are these underserved households located? Are unbanked communities also underbanked?
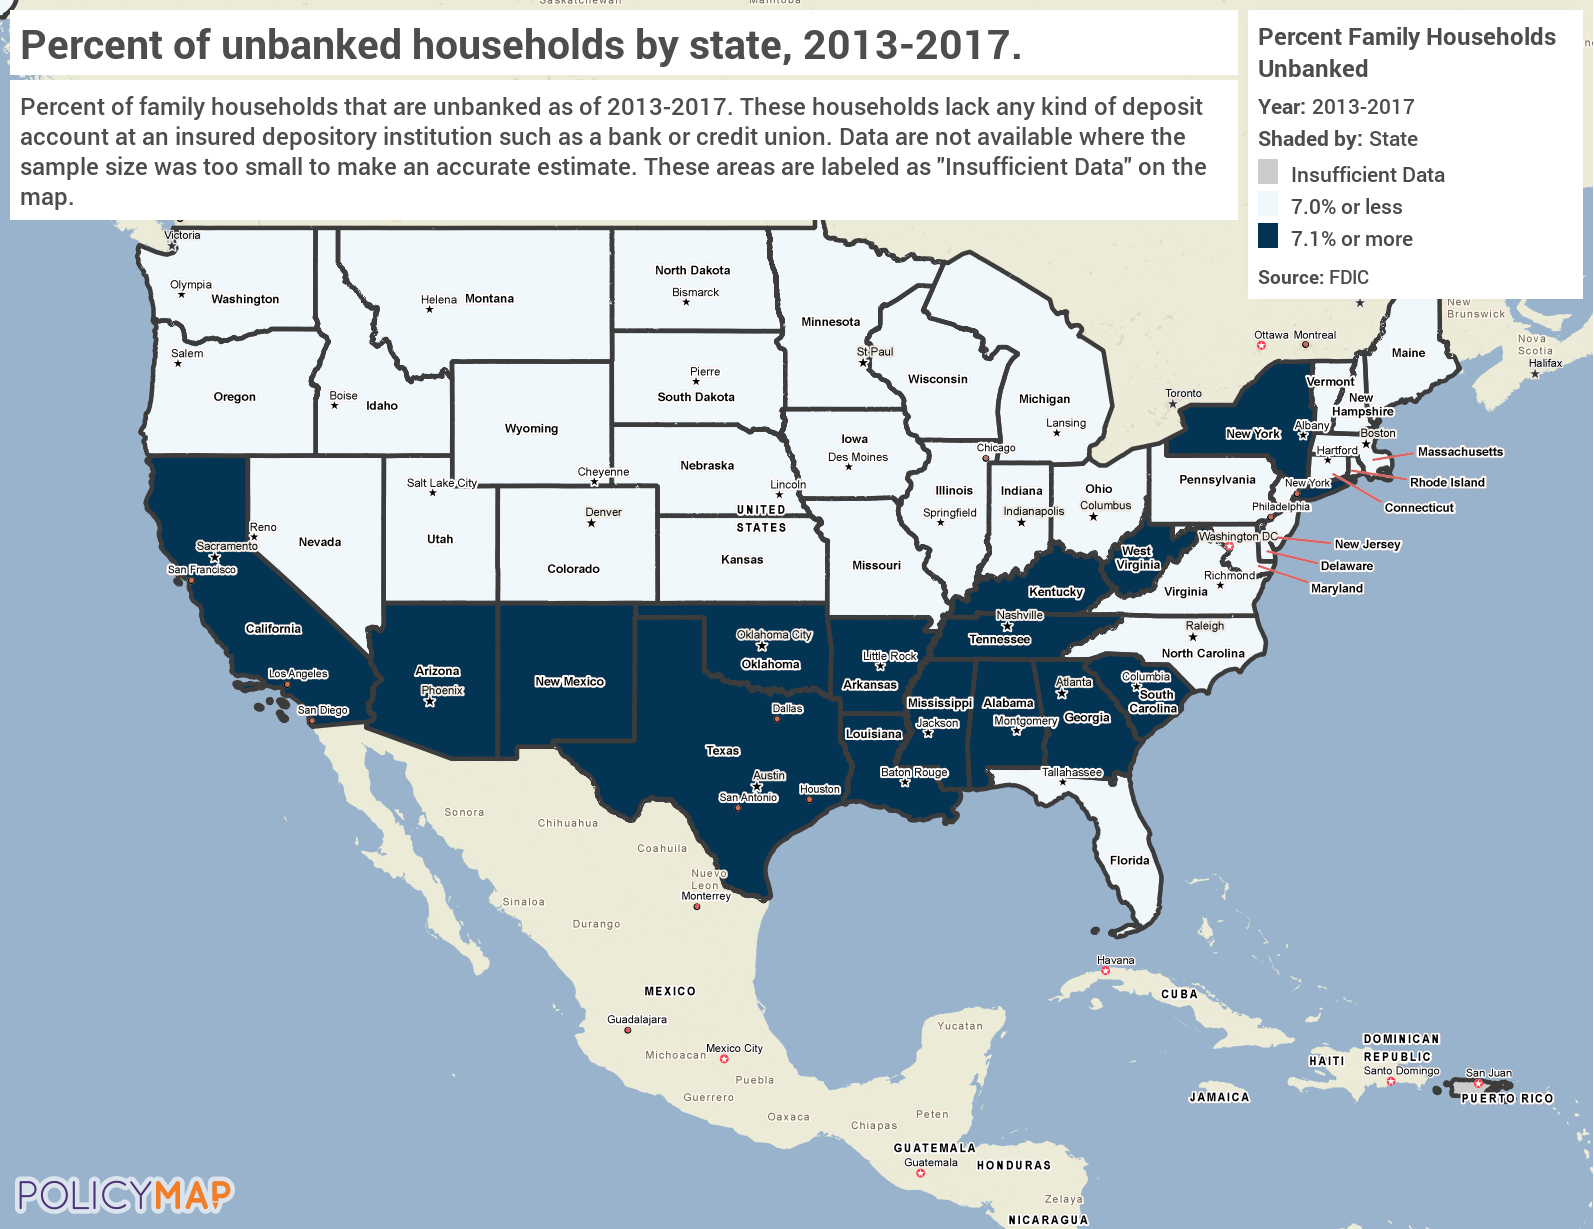
To answer those questions, let’s start with seven. Nationally, about seven percent of households are unbanked. But that population of unbanked households is not evenly distributed across the states. Of the unbanked states, Louisiana has the highest percent of unbanked households at over 13 percent. By contrast, only 1.5 percent of households in Vermont are unbanked.
As the below map shows, the states with the highest unbanked population are concentrated in the southern half of the country. With the exception of New York and California, every state that has a higher than average proportion of unbanked households lies south of the Mason-Dixon line.
But that map only tells one snapshot story of the underserved population. So, let’s move to the second important number, 20. The next map shows states that have underbanked populations above the national average of about 20 percent.

At first glance, comparing the relative density of unbanked and underbanked households lends some key insights. To start, there isn’t a partisan divide: unbanked and underbanked households exist in states as deep blue as California and New York and as ruby-red as Alabama and Arkansas.
The maps also show that the unbanked and underbanked populations do overlap. The South has large populations of both, but underbanked households are spread across a broader swath of the country. Interestingly, Midwestern and Great Plains states like Nebraska, Kansas, and Wyoming are underbanked but not unbanked.
Further, unbanked populations seem to be higher in states with more diversity, whether that is a higher share of immigrants in Arizona or California or a larger black population in deep South states. On the other hand, underbanked populations include the very homogenous Midwestern states, but do not include California or Arizona. This might mean that another factor, like rurality of a state, impacts the percent of underbanked households.
We’ll dig deeper into possible explanations of why different places and people might have higher rates of underserved populations in the next blog post.